Lesson 19
- Due Apr 23
1 System Overview
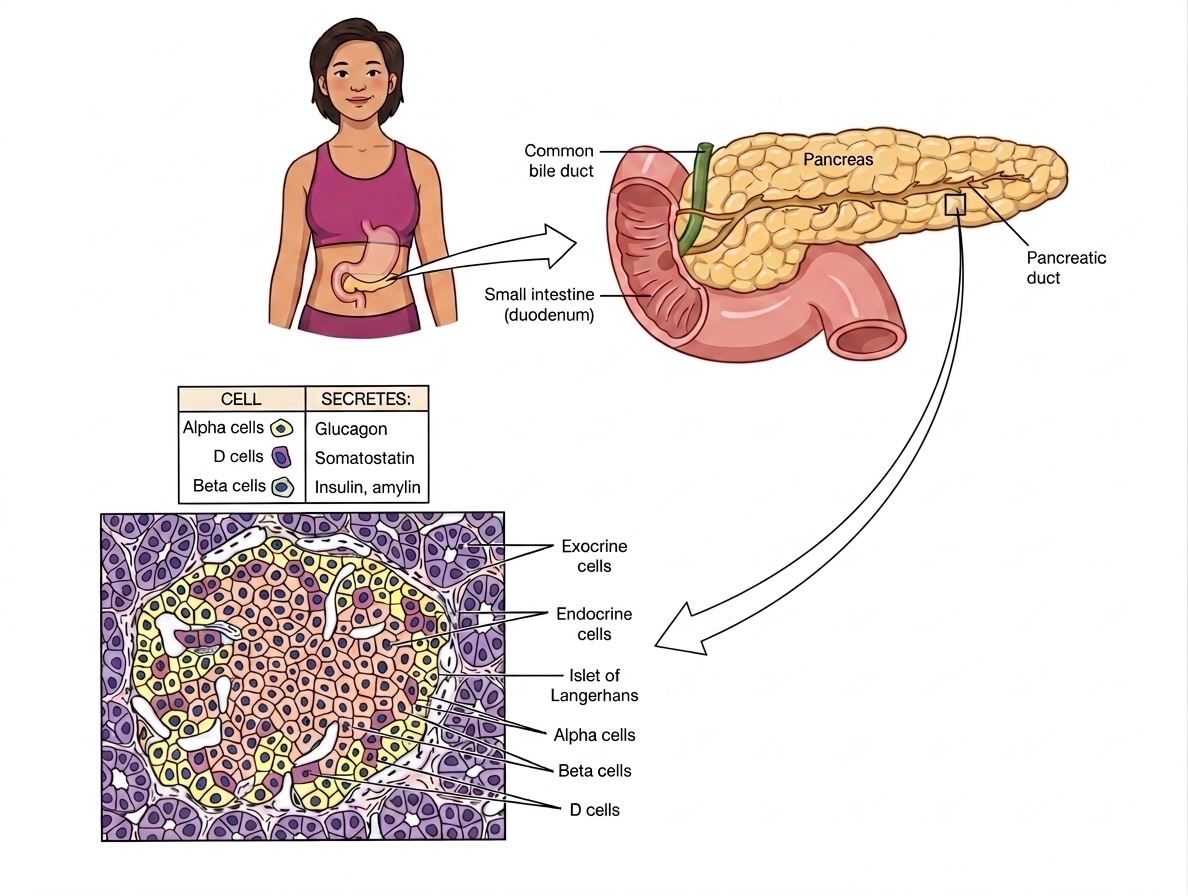
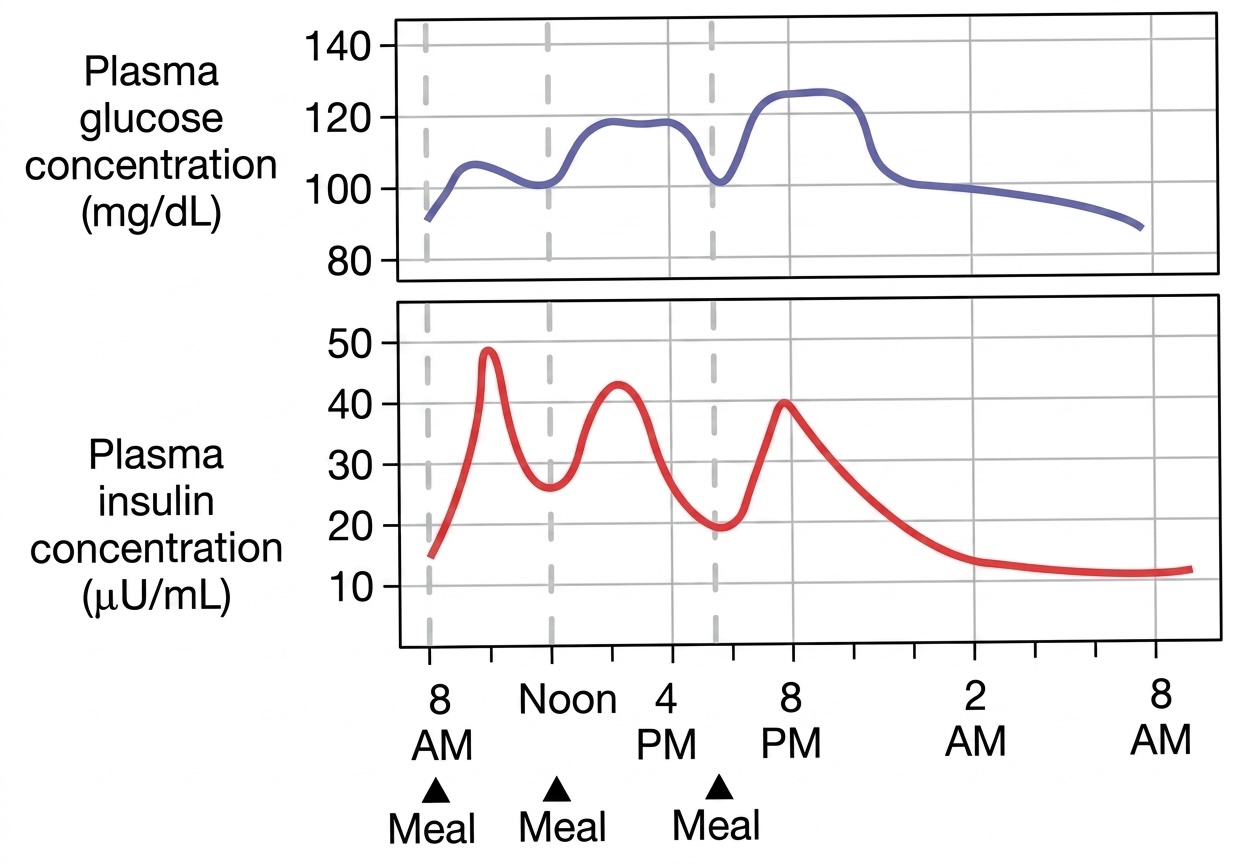
The human body carefully maintains fasting blood glucose concentrations within a range of 80–90 mg/dl of blood. This process is called glucose homeostasis. After a meal, blood glucose concentration increases. The increase in glucose is sensed by -cells in the pancreas (Figure 1) and they begin to secrete insulin in response. Insulin enters the blood where it is distributed throughout the body and signals cells to increase their glucose uptake from the blood. The liver, in particular, absorbs a significant amount of glucose compared to other tissues. The net result is that the blood glucose level falls back to its normal range. As the blood glucose level falls, the -cells sense less glucose and in response secrete less insulin. Figure 2 shows the effect of meals on blood glucose and blood insulin levels over a 24 hour period.
2 System Model
Assume we want to model glucose homeostasis and insulin homeostasis as a single compartment model. Since we wish to model two different mass species, we will need two differential equations.
The first differential equation is a mass balance for glucose (GLU). There is one input for GLU. It can enter the system through absorption from the gastrointestinal tract, intravenous infusion, or supply from the liver. There are two outputs for GLU: (1) passive diffusion into the liver and tissue (controlled by GLU concentration) and (2) facilitated diffusion into the tissues (controlled by insulin (INS) concentration), which can be 20x larger than the passive diffusion rate. Note that “controlled by” means “multiplied by”. Assume the coefficient is the rate constant for passive diffusion and the coefficient is the rate constant for facilitated diffusion.
The second differential equation is a mass balance for insulin (INS). There are two inputs for INS: (1) intravenous infusion (injection), and (2) production in the pancreas due to the beta-cells of the islets of Langerhans. Output is by inactivation (consumption) by blood insulinase activity. Assume the coefficient is the rate constant for consumption and is the rate constant for secretion from the pancreas.
3 Student Exercises
3.1 Student Exercise 1
Write the mass balance equations for glucose and insulin. Use as the variable for glucose mass and as the variable for insulin mass.
3.2 Student Exercise 2
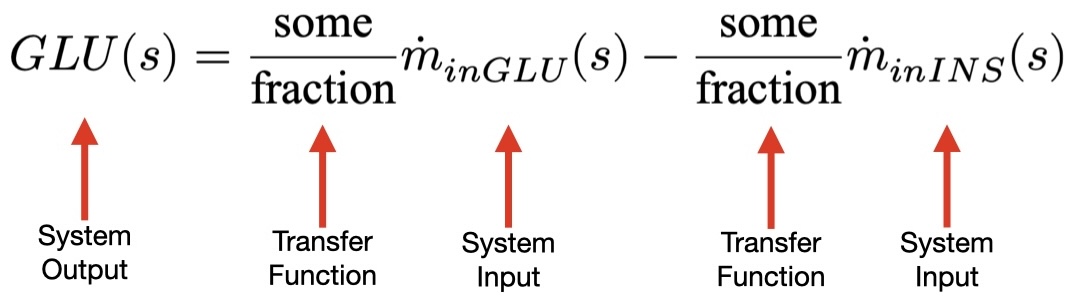
Convert the equations from Exercise 1 into Laplace notation and enter them into MATLAB. Use solve() to find expressions for and . Use the function collect() to simplify the expressions once you have solved for them. Rearrange the equations to get something that looks like the equations shown below.
and
3.3 Student Exercise 3
From visual inspection of the transfer functions from Exercise 2, what is the order of each system?
3.4 Student Exercise 4
Build a model containing the equations from Exercise 2 in Simulink. To get you started, consider visualizing the first equation like this:
Use a total simulation time of 24 (hrs). Use the variable solver ode15s. Enter the following values for the coefficients into your model:
Use SCOPE blocks to plot and . Assume is a step input with a value of 100 gm/hr and . What type of system does each response suggest? Why?
3.5 Student Exercise 5
Plot and if is an insulin step input with a value of 100 gm/hr and . What type of system does each response suggest? Why?
3.6 Student Exercise 6
What is the %OS for Exercises 4 and 5?
- You cannot directly calculate using the formulas we used in class because the transfer function has the term in the numerator. Instead, write the output of each to the workspace and find the maximum and then calculate the %OS.
3.7 Student Exercise 7
Assume the glucose transfer function is when . Assume when . Are and stable? Prove your answer.
3.8 Student Exercise 8
Determine the steady-state error for and . For SSE, assume and is a step input of amplitude 100 gm/hr. For SSE, assume and is a step input of amplitude 100 gm/hr.